

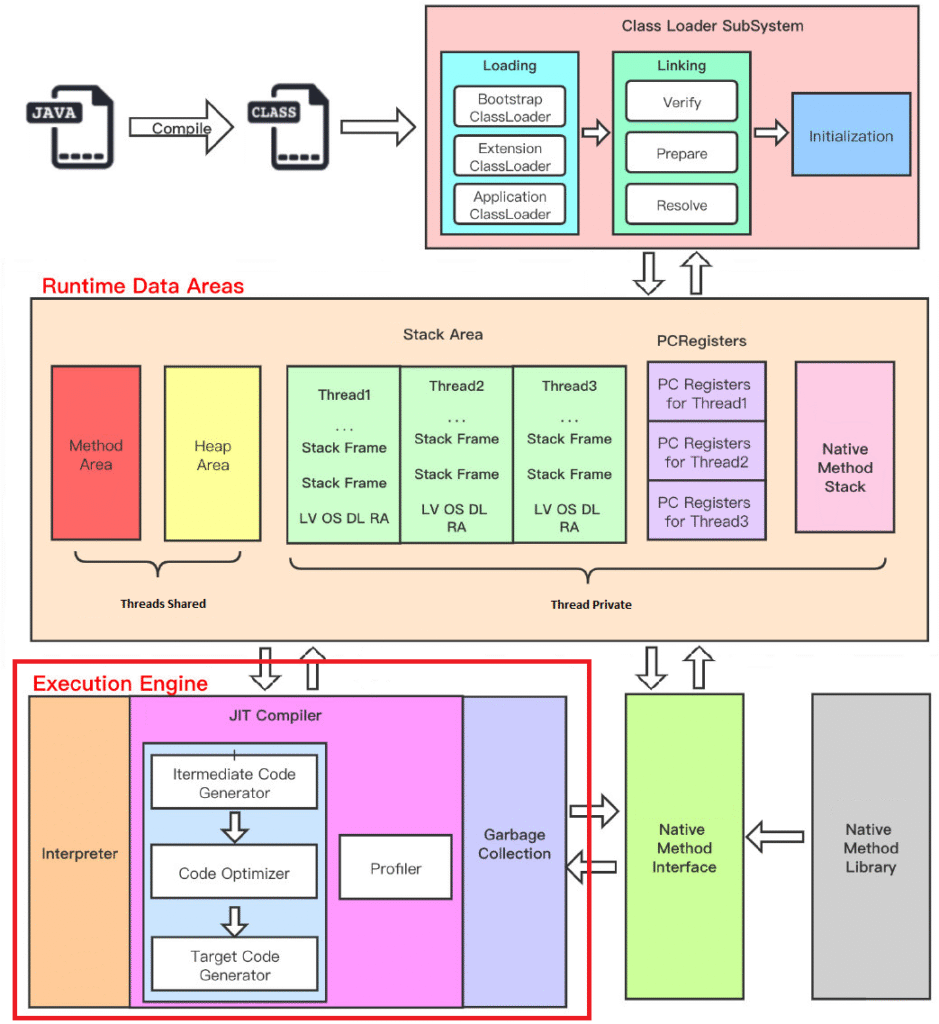
The execution engine runs the bytecode that has been loaded into the JVM’s runtime data areas by the class loader.
It is the central component of the JVM.
It translates java byte code into machine executable binary code (only contains 0 and 1).
What You Need
- About 15 minutes
- A favorite text editor or IDE
- Java 8 or later
1. Execution Engine Components
Execution Engine contains three main components to execute Java Classes.
1.1 Garbage Collector
It is a program in JVM that manages the memory automatically.
It is a daemon thread which always runs in the background to free up memory of heap and method area by destroying unreachable methods.
1.2 Interpreter
Interpreter reads the byte code and interprets into the machine code and executes them in a sequential manner.
The problem with the interpreter is that it interprets every time, even the same method multiple times, which reduces the performance of the system.
To overcome this problem, JIT Compilers is introduced into execution engine.
1.3 JIT (Just In Time) Compiler
JIT compiler counterbalances the interpreter’s disadvantage of slow execution and improves the performance.
For the same method beging executed multiple times, JIT compiler will first convert the entier byte code instructions of this method into machine code, then it will store the converted machine code into its code cache.
In this way, next time if the same method need to be executed, execution engine will use directly the machine code converted by JIT compiler instead of making interpreter convert the method’s byte code instructions one by one.
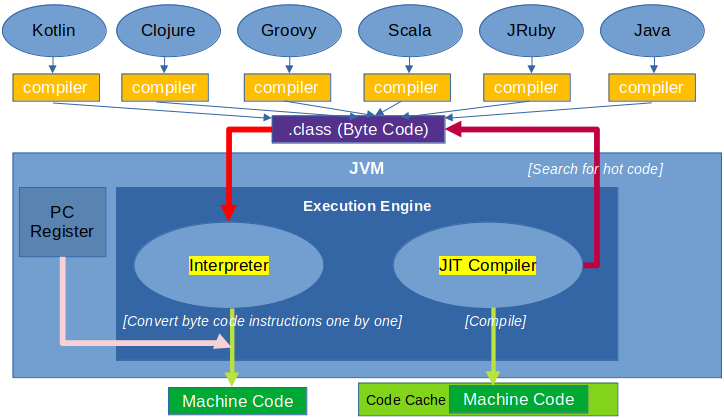
Below shows how interpreter and JIT compiler work together :
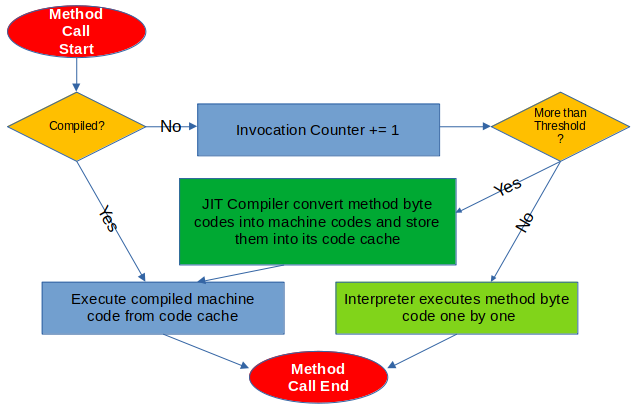
2. How JIT Compiler detects Hot Code
A method that is called multiple times, or a loop body with a large number of loops inside a method can be called hot code.
Therefore, this kind of hot code can be converted into machine code by JIT compiler.
Since this compilation happens during the execution of the method, it is also called OSR (On Stack Replacement) compilation.
How many times a method needs to be called, or how many times a loop body needs to be executed to meet this criterion?
There must be a threshold for JIT compiler to convert those hot code into machine code.
HotSpot JVM creates two different type of counter for each method : Invocation Counter and Back Edge Counter.
Invocation Counter counts the number of calls for a method.
Back Edge Counter counts the number of times the loop body executes in a method.
In bytecode, an instruction that encounters a backward jump in control flow is called Back Edge.
The default total threshold (sum of those two counters) is 1500 in client mode and 10000 in server mode, exceeding this threshold will trigger JIT compilation.
This total threshold can be manually set by the JVM flag -XX:CompileThreshold.
When a method is called, it will first check whether there is a JIT-Compiled version of the method.
If it exists, the compiled native machine code will be used to execute.
Otherwise, the invocation counter will be increased by 1.
If the sum of invocation counter and back edge counter is bigger than the value of -XX:CompileThreshold, JIT compiler will convert the byte codes of the method into machine codes and store them into code cache for further use.
The invocation counter does not count the absolute number of times the method is called, but the number of times the method is called within a period of time.
When a certain time limit is exceeded, if the number of invocations of the method is still not enough for it to be compiled by the JIT compiler, the invocation counter of this method will be reduced by half.
This process is called Counter Decay and this period of time is called Counter Half Life Time.
We can use JVM flag -XX:-UseCounterDecay to disable counter decay, in this way, as long as the runtime is long enough, most methods will be compiled by the JIT compiler into machine codes.
We can also use -XX:CounterHalfLifeTime to set up the counter half life time, its unit is seconds.
3. HotSopt JVM Execution Mode
For HotSpot JVM, we can set up its execution mode by below flags :
- -Xint : only use interpreter, it forces the JVM to interpret all bytecode instead of compiling it, this disables the JIT compilation entirely, as a result, executions slow down severely;
ovo@ovo:~$ java -Xint -version
java version "21.0.3" 2024-04-16 LTS
Java(TM) SE Runtime Environment (build 21.0.3+7-LTS-152)
Java HotSpot(TM) 64-Bit Server VM (build 21.0.3+7-LTS-152, interpreted mode, sharing)
- -Xcomp : only use JIT compiler, it forces the JVM to compile all methods at first use, but it often causes slower startup due to aggressive compilation, though it may deliver long-term performance gains;
ovo@ovo:~$ java -Xcomp -version
java version "21.0.3" 2024-04-16 LTS
Java(TM) SE Runtime Environment (build 21.0.3+7-LTS-152)
Java HotSpot(TM) 64-Bit Server VM (build 21.0.3+7-LTS-152, compiled mode, sharing)
- -Xmixed : use both interpreter and JIT compiler, it starts by interpreting the code and then compiles the hot methods using the JIT compiler, it help us balance startup time with long-term performance.
ovo@ovo:~$ java -Xmixed -version
java version "21.0.3" 2024-04-16 LTS
Java(TM) SE Runtime Environment (build 21.0.3+7-LTS-152)
Java HotSpot(TM) 64-Bit Server VM (build 21.0.3+7-LTS-152, mixed mode, sharing)
Without any set up, -Xmixed is the default execution mode for HotSpot JVM.
ovo@ovo:~$ java -version
java version "21.0.3" 2024-04-16 LTS
Java(TM) SE Runtime Environment (build 21.0.3+7-LTS-152)
Java HotSpot(TM) 64-Bit Server VM (build 21.0.3+7-LTS-152, mixed mode, sharing)
Below is a comparison of a heavy calculation run with different modes :
import java.time.Duration;
import java.time.Instant;

public class ExecutionModeTest {
    /**
     * -Xint -Xcomp -Xmixed -XX:+PrintCompilation -XX:+PrintCodeCache
     */
    public static void main(String[] args) {
        Instant inst1 = Instant.now();
        heavyCalculation(1000000);
        Instant inst2 = Instant.now();
        System.out.println("Elapsed Time: " + Duration.between(inst1, inst2).toMillis() + " ms");
    }

    private static void heavyCalculation(int count) {
        for (int i = 0; i < count; i++) {
            prime(100);
        }
    }

    private static void prime(int n) {
        label: for (int j = 2; j <= n; j++) {
            for (int k = 2; k <= Math.sqrt(j); k++) {
                if (j % k == 0) {
                    continue label;
                }
            }
            // System.out.println(j);
        }
    }
}
- -Xint :
ovo@ubuntu:~/github/BlogTests$ /usr/bin/env /home/ovo/Apps/jdk-21.0.3/bin/java -Xint -XX:+ShowCodeDetailsInExceptionMessages -cp /home/ovo/.config/Co
de/User/workspaceStorage/cb6e219fa798ac2300babcaaca8a9a47/redhat.java/jdt_ws/BlogTests_e0c01ebd/bin ExecutionModeTest
Elapsed Time: 5528 ms
- -Xcomp :
ovo@ubuntu:~/github/BlogTests$ /usr/bin/env /home/ovo/Apps/jdk-21.0.3/bin/java -Xcomp -XX:+ShowCodeDetailsInExceptionMessages -cp /home/ovo/.config/C
ode/User/workspaceStorage/cb6e219fa798ac2300babcaaca8a9a47/redhat.java/jdt_ws/BlogTests_e0c01ebd/bin ExecutionModeTest
Elapsed Time: 622 ms
- -Xmixed :
ovo@ubuntu:~/github/BlogTests$ /usr/bin/env /home/ovo/Apps/jdk-21.0.3/bin/java -Xmixed -XX:+ShowCodeDetailsInExceptionMessages -cp /home/ovo/.config/
Code/User/workspaceStorage/cb6e219fa798ac2300babcaaca8a9a47/redhat.java/jdt_ws/BlogTests_e0c01ebd/bin ExecutionModeTest
Elapsed Time: 644 ms
4. HotSpot JVM JIT Compilers
HotSpot JVM has two JIT Compilers : Client compiler and Server compiler.
Client compiler is also called C1 compiler, it is optimal for applications which need fast startup times or small footprints.
Server compiler is also called C2 compiler, it is optimal for applications where the overall performance is most important.
We can use those flages to set up which compiler to use : java -client or java -server.
For 64 bit system, by default, it uses server compiler and can not be changed to client compiler.
ovo@ovo:~$ java -version
java version "21.0.3" 2024-04-16 LTS
Java(TM) SE Runtime Environment (build 21.0.3+7-LTS-152)
Java HotSpot(TM) 64-Bit Server VM (build 21.0.3+7-LTS-152, mixed mode, sharing)
To have the best of both worlds, the tiered compilation concept was first introduced in Java 7.
Its goal was to use a mix of C1 and C2 compilers in order to achieve both fast startup and good long-term performance.
The tiered compilation is enabled by default since Java 8.
It’s highly recommended to use it even if we can disable it by setting the –XX:-TieredCompilation flag.
In tiered compilation, there are 5 compilation levels :
- Level 0 : Interpreted Code;
- Level 1 : Simple C1 Compiled Code;
- Level 2 : Limited C1 Compiled Code;
- Level 3 : Full C1 Compiled Code;
- Level 4 : C2 Compiled Code.
We can set threshold for compilation levels 2-4, for example, we can set a parameter -XX:Tier3CompileThreshold=10000.
It means that the JVM will wait until the method has been invoked (or looped) 10,000 times before promoting it to Tier 3.
In order to check the default thresholds used on a specific java version, we can run java using the -XX:+PrintFlagsFinal flag :
ovo@ovo:~$ java -XX:+PrintFlagsFinal -version | grep -i compilethreshold
     intx CompileThreshold                         = 10000
   double CompileThresholdScaling                  = 1.000000
    uintx IncreaseFirstTierCompileThresholdAt      = 50
     intx Tier2CompileThreshold                    = 0
     intx Tier3CompileThreshold                    = 2000
     intx Tier4CompileThreshold                    = 15000
java version "21.0.3" 2024-04-16 LTS
Java(TM) SE Runtime Environment (build 21.0.3+7-LTS-152)
Java HotSpot(TM) 64-Bit Server VM (build 21.0.3+7-LTS-152, mixed mode, sharing)
Please note that the JVM doesn’t use the generic CompileThreshold parameter when tiered compilation is enabled.
By default, JIT compilation logs are disabled, to enable them, we can set the -XX:+PrintCompilation flag.
ovo@ovo:~/github/BlogTests$ /usr/bin/env /home/ovo/Apps/jdk-21.0.3/bin/java -XX:+PrintCompilation -XX:+ShowCodeDetailsInExceptionMessages -cp /home/ovo/.config/C
ode/User/workspaceStorage/39f309f7697bdc3c26769b77ce745e7e/redhat.java/jdt_ws/jdt.ls-java-project/bin ExecutionModeTest
     52    1       3       java.lang.Object::<init> (1 bytes)
     57    2       3       java.lang.String::coder (15 bytes)
     58    3       3       java.lang.String::isLatin1 (19 bytes)
     61    4       3       java.lang.String::length (11 bytes)
     65    5       3       ExecutionModeTest::prime (42 bytes)
     66    6 %     4       ExecutionModeTest::prime @ 10 (42 bytes)
     69    7 %     4       ExecutionModeTest::prime @ 5 (42 bytes)
     71    8       4       ExecutionModeTest::prime (42 bytes)
     73    5       3       ExecutionModeTest::prime (42 bytes)   made not entrant
     73    8       4       ExecutionModeTest::prime (42 bytes)   made not entrant
     73    9       4       ExecutionModeTest::prime (42 bytes)
     75    9       4       ExecutionModeTest::prime (42 bytes)   made not entrant
     78   10       4       ExecutionModeTest::prime (42 bytes)
    139   11 %     3       ExecutionModeTest::heavyCalculation @ 5 (19 bytes)
    141   12       3       ExecutionModeTest::heavyCalculation (19 bytes)
    184   13 %     4       ExecutionModeTest::heavyCalculation @ 5 (19 bytes)
    186   11 %     3       ExecutionModeTest::heavyCalculation @ 5 (19 bytes)   made not entrant
    927   13 %     4       ExecutionModeTest::heavyCalculation @ 5 (19 bytes)   made not entrant
    928   14       3       java.lang.String::hashCode (60 bytes)
    930   15     n 0       java.lang.invoke.MethodHandle::linkToStatic(LLLLLL)L (native)   (static)
    932   16     n 0       java.lang.invoke.MethodHandle::invokeBasic(LLLLL)L (native)
    932   17     n 0       java.lang.invoke.MethodHandle::linkToSpecial(LLLLLLL)L (native)   (static)
    932   18     n 0       java.lang.Object::hashCode (native)
    933   19       1       java.lang.Enum::ordinal (5 bytes)
    933   20     n 0       java.lang.invoke.MethodHandle::linkToStatic(LJL)L (native)   (static)
    934   21       3       java.util.Objects::requireNonNull (14 bytes)
    935   22     n 0       java.lang.invoke.MethodHandle::linkToStatic(LLL)L (native)   (static)
    936   23       3       java.util.concurrent.ConcurrentHashMap::tabAt (22 bytes)
    936   25     n 0       java.lang.invoke.MethodHandle::linkToStatic(LLLL)L (native)   (static)
    936   24       3       jdk.internal.misc.Unsafe::getReferenceAcquire (7 bytes)
    937   26       3       java.util.concurrent.ConcurrentHashMap::spread (10 bytes)
    937   27     n 0       java.lang.Class::isPrimitive (native)
    938   28     n 0       java.lang.invoke.MethodHandle::invokeBasic(LJ)L (native)
    938   29     n 0       java.lang.invoke.MethodHandle::linkToSpecial(LLJL)L (native)   (static)
    939   30       1       java.lang.invoke.MethodType::returnType (5 bytes)
    940   31       3       jdk.internal.util.Preconditions::checkIndex (18 bytes)
    940   32       3       java.lang.String::charAt (25 bytes)
    942   33       4       java.lang.Object::<init> (1 bytes)
    942   34     n 0       java.lang.System::arraycopy (native)   (static)
    942    1       3       java.lang.Object::<init> (1 bytes)   made not entrant
    944   35       3       java.lang.invoke.MethodTypeForm::canonicalize (74 bytes)
    944   36     n 0       java.lang.invoke.MethodHandle::linkToStatic(JLJLL)J (native)   (static)
    944   37     n 0       java.lang.invoke.MethodHandle::invokeBasic(JLJL)J (native)
    945   38     n 0       java.lang.invoke.MethodHandle::linkToSpecial(LJLJLL)J (native)   (static)
    946   39     n 0       java.lang.invoke.MethodHandle::linkToStatic(LLLLL)L (native)   (static)
    946   40     n 0       java.lang.invoke.MethodHandle::invokeBasic(LLLL)L (native)
    947   41       3       java.lang.Math::min (11 bytes)
    948   42     n 0       java.lang.invoke.MethodHandle::invokeBasic(JLJ)J (native)
    948   43     n 0       java.lang.invoke.MethodHandle::linkToSpecial(LJLJL)J (native)   (static)
    950   44       3       jdk.internal.org.objectweb.asm.SymbolTable::get (13 bytes)
    951   45       1       java.lang.invoke.MemberName::getDeclaringClass (5 bytes)
    951   47     n 0       java.lang.invoke.MethodHandle::invokeBasic(J)L (native)
    951   48     n 0       java.lang.invoke.MethodHandle::linkToSpecial(LJL)L (native)   (static)
    951   46       3       java.lang.invoke.MethodType::checkSlotCount (33 bytes)
    953   49       3       jdk.internal.org.objectweb.asm.SymbolTable::hash (10 bytes)
    953   50       3       jdk.internal.org.objectweb.asm.ByteVector::putUTF8 (144 bytes)
    953   52     n 0       java.lang.invoke.MethodHandle::linkToStatic(JJL)J (native)   (static)
    953   54     n 0       java.lang.invoke.MethodHandle::invokeBasic(JJ)J (native)
    953   55     n 0       java.lang.invoke.MethodHandle::linkToSpecial(LJJL)J (native)   (static)
    954   56     n 0       java.lang.invoke.MethodHandle::linkToStatic(LLLJL)L (native)   (static)
    954   51       3       java.lang.invoke.MemberName::isInvocable (8 bytes)
    955   53       1       java.lang.invoke.MethodType::ptypes (5 bytes)
    955   57     n 0       java.lang.invoke.MethodHandle::invokeBasic(LLLJ)L (native)
    957   60     n 0       java.lang.invoke.MethodHandle::linkToStatic(LLLLLLL)L (native)   (static)
    957   58       3       jdk.internal.org.objectweb.asm.Symbol::<init> (38 bytes)
    958   59       3       jdk.internal.org.objectweb.asm.SymbolTable::put (150 bytes)
    959   61     n 0       java.lang.invoke.MethodHandle::invokeBasic(J)J (native)
    959   62       1       java.lang.invoke.MethodType::form (5 bytes)
    960   63     n 0       java.lang.invoke.MethodHandle::linkToSpecial(LJL)J (native)   (static)
    960   64       3       java.lang.invoke.LambdaForm$BasicType::basicType (187 bytes)
    960   66     n 0       java.lang.invoke.MethodHandle::invokeBasic(LLLLLL)L (native)
    961   68       3       java.lang.invoke.MethodType::hashCode (53 bytes)
    961   69       3       jdk.internal.util.ArraysSupport::signedHashCode (37 bytes)
    962   67       3       java.lang.invoke.LambdaForm$BasicType::basicType (8 bytes)
    962   65       3       java.util.Objects::equals (23 bytes)
Elapsed Time: 864 ms
The compilation logs are formatted as :
| FIELD | DESCRIPTION |
|---|---|
| Timestamp | In milliseconds since application start-up |
| Compile ID | Incremental ID for each compiled method |
| Attributes | The state of the compilation, % means on stack replacement occurred |
| Compilation Level | Between 0 and 4 |
| Method Name | N/A |
| Bytecode Size | N/A |
| Deoptimisation Indicator | Made not entrant or Made zombie |
5. Code Cache
Code Cache is an area where JVM stores its bytecode compiled into native machine code by JIT compilers.
The code cache has a fixed size.
Once it is full, the JIT compilers won’t compile any additional code.
As a result, we’ll end up with degraded performance in the application.
We can use following JVM flags to set up the code cache size :
- -XX:InitialCodeCacheSize=N : the initial code cache size;
- -XX:ReservedCodeCacheSize=N : the maximum code cache size.
ovo@ovo:~$ java -XX:+PrintFlagsFinal -version | grep -i codecachesize
    uintx InitialCodeCacheSize                     = 2555904
    uintx ReservedCodeCacheSize                    = 251658240
java version "21.0.3" 2024-04-16 LTS
Java(TM) SE Runtime Environment (build 21.0.3+7-LTS-152)
Java HotSpot(TM) 64-Bit Server VM (build 21.0.3+7-LTS-152, mixed mode, sharing)
We can increase its maximum size by modifying the value of the ReservedCodeCacheSize flag.
JVM offers also -XX:+UseCodeCacheFlushing flag to control the flushing of the code cache area.
When this flag is enabled, JVM frees the occupied area when the following conditions are met :
- the code cache is full (its size exceeds a certain threshold);
- the certain interval is passed since the last cleanup;
- the precompiled code isn’t hot enough (the value of hot code counter is less than a computed threshold).
To get information on code cache usage, we can use –XX:+PrintCodeCache flag :
ovo@ovo:~/github/BlogTests$ /usr/bin/env /home/ovo/Apps/jdk-21.0.3/bin/java -XX:+PrintCodeCache -XX:+ShowCodeDetailsInExceptionMessages -cp /home/ovo/.config/Cod
e/User/workspaceStorage/39f309f7697bdc3c26769b77ce745e7e/redhat.java/jdt_ws/jdt.ls-java-project/bin ExecutionModeTest
Elapsed Time: 742 ms
CodeHeap 'non-profiled nmethods': size=120032Kb used=32Kb max_used=32Kb free=119999Kb
 bounds [0x0000703e044c8000, 0x0000703e04738000, 0x0000703e0ba00000]
CodeHeap 'profiled nmethods': size=120028Kb used=51Kb max_used=51Kb free=119976Kb
 bounds [0x0000703dfca00000, 0x0000703dfcc70000, 0x0000703e03f37000]
CodeHeap 'non-nmethods': size=5700Kb used=1232Kb max_used=1239Kb free=4467Kb
 bounds [0x0000703e03f37000, 0x0000703e041a7000, 0x0000703e044c8000]
 total_blobs=442 nmethods=74 adapters=274
 compilation: enabled
              stopped_count=0, restarted_count=0
 full_count=0
Each of these values mean :
| FIELD | DESCRIPTION |
|---|---|
| size | the maximum size of the memory, which is identical to ReservedCodeCacheSize |
| used | the actual size of the memory that currently is in use |
| max_used | the maximum size that has been in use |
| free | the remaining memory which is not occupied yet |
As of Java 9, the JVM divides the code cache into three distinct segments :
- non-nmethods : contains JVM internal related code such as the bytecode interpreter (it can be configured by -XX:NonNMethodCodeHeapSize flag);
- profiled nmethods : contains lightly optimized code with potentially short lifetimes (it can be configured by -XX:ProfiledCodeHeapSize flag);
- non-profiled nmethods : contains fully optimized code with potentially long lifetimes (it can be configured by -XX:NonProfiledCodeHeapSize flag).
This new structure treats various types of complied code differently, which leads to better overall performance.