

When Java applications misbehave in production, logs are often not enough – and restarting the system is usually not an option.
Sooner or later, every Java developer faces issues that cannot be reproduced locally and must be diagnosed directly on a running JVM.
Java provides a set of powerful standard troubleshooting tools such as jps, jinfo, jstat, jstack, jmap and jcmd, which are essential for understanding JVM state, threads, memory, and performance.
However, in many real-world scenarios, these tools alone may not provide enough visibility into application-level behavior.
This is where third-party Java troubleshooting tools like BTrace and Arthas shine – allowing developers to trace execution, monitor runtime behavior, and diagnose problems live, safely, and efficiently, without modifying code or restarting the application.
- 1. Byte Code Tracing – BTrace
- 2. Alibaba Java Diagnostic Tool – Arthas
- 2.1 dashboard – real time statistics dashboard for the current system
- 2.2 thread – check the basic info and stack trace of the target thread
- 2.3 jad – decompile the specified classes
- 2.4 stack – print out the full call stack of the current method
- 2.5 trace – trace method calling path, and output the time cost for each node in the path
- 2.6 watch – monitor methods in data aspect including return values, exceptions and parameters …
- 2.7 profiler – generate a flame graph using async-profiler
- Conclusion
1. Byte Code Tracing – BTrace
BTrace is a safe, dynamic tracing tool for the java platform.
It dynamically instruments the classes of the target application to inject tracing code.
The first way to get BTrace is to download the source code on their github repo and build a binary yourself :
https://github.com/btraceio/btrace
The second way is to download directly a binary distribution file from below link :
https://github.com/btraceio/btrace/releases
To do a demo of btrace, we changed our random test class to extract every step into a method :
import java.util.concurrent.TimeUnit;

/**
 * -agentlib:jdwp=transport=dt_socket,server=y,suspend=n,address=9999
 */
public class RandomTest {
    public static void main(String[] args) throws InterruptedException {
        while (true) {
            process();
        }
    }

    private static void process() throws InterruptedException {
        sleep(1);
        print(random());
    }

    private static void print(double random) {
        System.out.println(random);
    }

    private static double random() {
        return Math.random();
    }

    private static void sleep(int time) throws InterruptedException {
        TimeUnit.SECONDS.sleep(time);
    }
}
What we want is to trace every method call when this random test will be executed.
To do so, we need to firstly create a btrace script.
A btrace script is a normal java file in which we can use btrace api to describe what and how to trace.
Below is the btrace script to trace all method call for our random test :
import static org.openjdk.btrace.core.BTraceUtils.print;

import org.openjdk.btrace.core.BTraceUtils.Strings;
import org.openjdk.btrace.core.annotations.BTrace;
import org.openjdk.btrace.core.annotations.OnMethod;
import org.openjdk.btrace.core.annotations.ProbeClassName;
import org.openjdk.btrace.core.annotations.ProbeMethodName;

@BTrace
public class AllMethods {
    @OnMethod(clazz = "/RandomTest*/", method = "/.*/")
    public static void m(@ProbeClassName String probeClass,
            @ProbeMethodName String probeMethod) {
        print(Strings.strcat(probeClass, Strings.strcat(".", probeMethod)));
    }
}
When creating the script, we need btrace apis to make it compilable.
The jars can be found in libs of btrace folder :
- btrace-agent.jar
- btrace-boot.jar
- btrace-client.jar
Once script has be created, we run : <btrace>/bin/btrace <PID> <trace_script> to attach to the java application with the given PID and compile/submit the trace script.
We can see that every method call of our random test are traced now :
btrace 28202 AllMethods.java

btrace INFO: Attaching BTrace to PID: 28202
btrace INFO: Successfully started BTrace probe: AllMethods.java
RandomTest.random
RandomTest.print
RandomTest.sleep
RandomTest.random
RandomTest.print
RandomTest.sleep
RandomTest.random
RandomTest.print
RandomTest.sleep
RandomTest.random
RandomTest.print
RandomTest.sleep
RandomTest.random
RandomTest.print
RandomTest.sleep
More example scripts are available in samples of btrace folder :
~/apps/btrace-v2.2.0-bin/samples$ ls

AllCalls1.java          DTraceRefDemo.java    OnThrow.java
AllCalls1Sampled.java   FileTracker.java      ProbeArgs.java
AllCalls2.java          FileTrackerJfr.java   ProbeExit.java
AllCalls2Sampled.java   FinalizeTracker.java  Profiling.java
AllCalls3.java          HistogramBean.java    Sizeof.java
AllCalls3Sampled.java   Histogram.java        SocketTracker1.java
AllLines.java           HistoOnEvent.java     SocketTracker.java
AllMethods1.java        java.net.socket.xml   SubtypeTracer.java
AllMethods.java         JdbcQueries.java      syscalls.d
AllMethodsLevels.java   JInfo.java            SysProp.java
AllMethodsSampled.java  JMap.java             Test.java
AllSync.java            JStack.java           ThreadBean.java
ArgArray.java           jthread.d             ThreadCounterBean.java
AWTEventTracer.java     jurls.d               ThreadCounter.java
btracedefs.h            LogTracer.java        ThreadStart.java
classload.d             MemAlerter.java       Timers.java
Classload.java          Memory.java           URLTracker.java
CommandArg.java         MultiClass.java       WebServiceTracker.java
Deadlock.java           NewArray.java
DTraceInline.java       NewComponent.java
2. Alibaba Java Diagnostic Tool – Arthas
Arthas allows developers to troubleshoot production issues for java applications without modifying code or restarting servers.
It can be downloaded from its github repo :
https://github.com/alibaba/arthas/releases
Go into arthas folder and run below to start it :
java -jar arthas-boot.jar
Select the java process to which we are interested.
java -jar arthas-boot.jar

[INFO] JAVA_HOME: /home/ovo/Apps/jdk-21.0.3
[INFO] arthas-boot version: 4.1.3
[INFO] Found existing java process, please choose one and input the serial number of the process, eg : 1. Then hit ENTER.
* [1]: 6120 /home/ovo/.vscode/extensions/redhat.java-1.50.0-linux-x64/server/plugins/org.eclipse.equinox.launcher_1.7.100.v20251111-0406.jar
  [2]: 8204 RandomTest
Once attached to the process, it will enter into CLI mode.
java -jar arthas-boot.jar

[INFO] JAVA_HOME: /home/ovo/Apps/jdk-21.0.3
[INFO] arthas-boot version: 4.1.3
[INFO] Found existing java process, please choose one and input the serial number of the process, eg : 1. Then hit ENTER.
* [1]: 6120 /home/ovo/.vscode/extensions/redhat.java-1.50.0-linux-x64/server/plugins/org.eclipse.equinox.launcher_1.7.100.v20251111-0406.jar
  [2]: 8204 RandomTest
2
[INFO] arthas home: /home/ovo/Apps/arthas-bin
[INFO] Try to attach process 8204
Picked up JAVA_TOOL_OPTIONS:
[INFO] Attach process 8204 success.
[INFO] arthas-client connect 127.0.0.1 3658
  ,---.  ,------. ,--------.,--.  ,--.  ,---.   ,---.
 /  O  \ |  .--. ''--.  .--'|  '--'  | /  O  \ '   .-'
|  .-.  ||  '--'.'   |  |   |  .--.  ||  .-.  |`.  `-.
|  | |  ||  |\  \    |  |   |  |  |  ||  | |  |.-'    |
`--' `--'`--' '--'   `--'   `--'  `--'`--' `--'`-----'

wiki         https://arthas.aliyun.com/doc
tutorials    https://arthas.aliyun.com/doc/arthas-tutorials.html
version      4.1.3
main_class   RandomTest
pid          8204
start_time   2025-12-26 10:46:53.694
current_time 2025-12-26 10:49:17.011

[arthas@8204]$
We can then use different commands to do diagnostics.
2.1 dashboard – real time statistics dashboard for the current system
ID      NAME                                          GROUP                  PRIORITY       STATE          %CPU            DELTA_TIME     TIME           INTERRUPTED     DAEMON
35      Timer-for-arthas-dashboard-403b5444-2451-403a system                 5              RUNNABLE       0.77            0.038          0:0.188        false           true
33      arthas-NettyHttpTelnetBootstrap-3-2           system                 5              RUNNABLE       0.3             0.014          0:0.200        false           true
1       main                                          main                   5              TIMED_WAITING  0.04            0.002          0:0.169        false           false
9       Reference Handler                             system                 10             RUNNABLE       0.0             0.000          0:0.001        false           true
10      Finalizer                                     system                 8              WAITING        0.0             0.000          0:0.000        false           true
11      Signal Dispatcher                             system                 9              RUNNABLE       0.0             0.000          0:0.000        false           true
16      Notification Thread                           system                 9              RUNNABLE       0.0             0.000          0:0.000        false           true
17      Common-Cleaner                                InnocuousThreadGroup   8              TIMED_WAITING  0.0             0.000          0:0.002        false           true
18      Attach Listener                               system                 9              RUNNABLE       0.0             0.000          0:0.093        false           true
20      arthas-timer                                  system                 9              WAITING        0.0             0.000          0:0.000        false           true
27      arthas-NettyHttpTelnetBootstrap-3-1           system                 5              RUNNABLE       0.0             0.000          0:0.023        false           true
28      arthas-NettyWebsocketTtyBootstrap-4-1         system                 5              RUNNABLE       0.0             0.000          0:0.001        false           true
29      arthas-NettyWebsocketTtyBootstrap-4-2         system                 5              RUNNABLE       0.0             0.000          0:0.001        false           true
30      arthas-shell-server                           system                 9              TIMED_WAITING  0.0             0.000          0:0.002        false           true
31      arthas-session-manager                        system                 9              TIMED_WAITING  0.0             0.000          0:0.001        false           true
34      arthas-command-execute                        system                 5              TIMED_WAITING  0.0             0.000          0:0.005        false           true


Memory                                 used          total        max          usage        GC
heap                                   15M           48M          3988M        0.38%        gc.g1_young_generation.count                  5
g1_eden_space                          4M            26M          -1           15.38%       gc.g1_young_generation.time(ms)               30
g1_old_gen                             8M            18M          3988M        0.21%        gc.g1_concurrent_gc.count                     2
g1_survivor_space                      2M            4M           -1           72.39%       gc.g1_concurrent_gc.time(ms)                  2
nonheap                                37M           40M          -1           92.74%       gc.g1_old_generation.count                    0
codeheap_'non-nmethods'                1M            2M           5M           27.54%       gc.g1_old_generation.time(ms)                 0
metaspace                              27M           27M          -1           98.78%
codeheap_'profiled_nmethods'           4M            4M           117M         4.16%
compressed_class_space                 3M            3M           1024M        0.30%
codeheap_'non-profiled_nmethods'       899K          2496K        120036K      0.75%
mapped                                 0K            0K           -            0.00%
direct                                 4M            4M           -            100.00%
mapped - 'non-volatile memory'         0K            0K           -            0.00%
Runtime
os.name                                                                                     Linux
os.version                                                                                  6.8.0-90-generic
java.version                                                                                21.0.3
java.home                                                                                   /home/ovo/Apps/jdk-21.0.3
systemload.average                                                                          1.37
processors                                                                                  3
timestamp/uptime                                                                            Fri Dec 26 10:51:47 CET 2025/293s
2.2 thread – check the basic info and stack trace of the target thread
Below is an example to find out top 3 busiest threads with stack traces printed :
[arthas@6870]$ thread -n 3

"arthas-command-execute" Id=44 cpuUsage=0.47% deltaTime=0ms time=11ms RUNNABLE
    at java.management@25.0.1/sun.management.ThreadImpl.dumpThreads0(Native Method)
    at java.management@25.0.1/sun.management.ThreadImpl.getThreadInfo(ThreadImpl.java:469)
    at com.taobao.arthas.core.command.monitor200.ThreadCommand.processTopBusyThreads(ThreadCommand.java:206)
    at com.taobao.arthas.core.command.monitor200.ThreadCommand.process(ThreadCommand.java:122)
    at com.taobao.arthas.core.shell.command.impl.AnnotatedCommandImpl.process(AnnotatedCommandImpl.java:82)
    at com.taobao.arthas.core.shell.command.impl.AnnotatedCommandImpl.access$100(AnnotatedCommandImpl.java:18)
    at com.taobao.arthas.core.shell.command.impl.AnnotatedCommandImpl$ProcessHandler.handle(AnnotatedCommandImpl.java:113)
    at com.taobao.arthas.core.shell.command.impl.AnnotatedCommandImpl$ProcessHandler.handle(AnnotatedCommandImpl.java:110)
    at com.taobao.arthas.core.shell.system.impl.ProcessImpl$CommandProcessTask.run(ProcessImpl.java:385)
    at java.base@25.0.1/java.util.concurrent.Executors$RunnableAdapter.call(Executors.java:545)
    at java.base@25.0.1/java.util.concurrent.FutureTask.run(FutureTask.java:328)
    at java.base@25.0.1/java.util.concurrent.ScheduledThreadPoolExecutor$ScheduledFutureTask.run(ScheduledThreadPoolExecutor.java:309)
    at java.base@25.0.1/java.util.concurrent.ThreadPoolExecutor.runWorker(ThreadPoolExecutor.java:1090)
    at java.base@25.0.1/java.util.concurrent.ThreadPoolExecutor$Worker.run(ThreadPoolExecutor.java:614)
    at java.base@25.0.1/java.lang.Thread.runWith(Thread.java:1487)
    at java.base@25.0.1/java.lang.Thread.run(Thread.java:1474)


"main" Id=3 cpuUsage=0.0% deltaTime=0ms time=143ms TIMED_WAITING
    at java.base@25.0.1/java.lang.Thread.sleepNanos0(Native Method)
    at java.base@25.0.1/java.lang.Thread.sleepNanos(Thread.java:509)
    at java.base@25.0.1/java.lang.Thread.sleep(Thread.java:577)
    at java.base@25.0.1/java.util.concurrent.TimeUnit.sleep(TimeUnit.java:446)
    at app//RandomTest.main(RandomTest.java:9)


"Reference Handler" Id=13 cpuUsage=0.0% deltaTime=0ms time=1ms RUNNABLE
    at java.base@25.0.1/java.lang.ref.Reference.waitForReferencePendingList(Native Method)
    at java.base@25.0.1/java.lang.ref.Reference.processPendingReferences(Reference.java:246)
    at java.base@25.0.1/java.lang.ref.Reference$ReferenceHandler.run(Reference.java:208)
2.3 jad – decompile the specified classes
[arthas@6870]$ jad RandomTest

ClassLoader:
+-jdk.internal.loader.ClassLoaders$AppClassLoader@341d43cd
  +-jdk.internal.loader.ClassLoaders$PlatformClassLoader@d792ed7

Location:
/home/ovo/.config/Code/User/workspaceStorage/2dd0ba3c459d2c4a6e96b3607036ee65/redhat.java/jdt_ws/jdt.ls-java-project/bin/

       /*
        * Decompiled with CFR.
        */
       import java.util.concurrent.TimeUnit;

       public class RandomTest {
           public static void main(String[] args) throws InterruptedException {
               while (true) {
/* 9*/             TimeUnit.SECONDS.sleep(1L);
/*10*/             double random = Math.random();
/*11*/             System.out.println(random);
               }
           }
       }

Affect(row-cnt:1) cost in 710 ms.
2.4 stack – print out the full call stack of the current method
[arthas@6099]$ stack RandomTest

Press Q or Ctrl+C to abort.
Affect(class count: 1 , method count: 6) cost in 216 ms, listenerId: 1
ts=2025-12-28 06:24:51.040;thread_name=main;id=3;is_daemon=false;priority=5;TCCL=jdk.internal.loader.ClassLoaders$AppClassLoader@341d43cd
    @RandomTest.random()
        at RandomTest.process(null:15)
        at RandomTest.main(null:9)

ts=2025-12-28 06:24:51.042;thread_name=main;id=3;is_daemon=false;priority=5;TCCL=jdk.internal.loader.ClassLoaders$AppClassLoader@341d43cd
    @RandomTest.print()
        at RandomTest.process(null:15)
        at RandomTest.main(null:9)

ts=2025-12-28 06:24:52.044;thread_name=main;id=3;is_daemon=false;priority=5;TCCL=jdk.internal.loader.ClassLoaders$AppClassLoader@341d43cd
    @RandomTest.sleep()
        at RandomTest.process(RandomTest.java:14)
        at RandomTest.main(null:9)
2.5 trace – trace method calling path, and output the time cost for each node in the path
[arthas@6099]$ trace RandomTest process

Press Q or Ctrl+C to abort.
Affect(class count: 1 , method count: 1) cost in 82 ms, listenerId: 2
`---ts=2025-12-28 06:26:41.248;thread_name=main;id=3;is_daemon=false;priority=5;TCCL=jdk.internal.loader.ClassLoaders$AppClassLoader@341d43cd

`---ts=2025-12-28 06:26:41.250;thread_name=main;id=3;is_daemon=false;priority=5;TCCL=jdk.internal.loader.ClassLoaders$AppClassLoader@341d43cd
    `---[1001.12013ms] RandomTest:process()
        +---[99.96% 1000.743913ms ] RandomTest:sleep() #14
        +---[0.00% 0.01662ms ] RandomTest:random() #15
        `---[0.02% 0.153184ms ] RandomTest:print() #15

`---ts=2025-12-28 06:26:42.263;thread_name=main;id=3;is_daemon=false;priority=5;TCCL=jdk.internal.loader.ClassLoaders$AppClassLoader@341d43cd
    `---[1000.533521ms] RandomTest:process()
        +---[99.97% 1000.254762ms ] RandomTest:sleep() #14
        +---[0.00% 0.01386ms ] RandomTest:random() #15
        `---[0.02% 0.173234ms ] RandomTest:print() #15

`---ts=2025-12-28 06:26:43.265;thread_name=main;id=3;is_daemon=false;priority=5;TCCL=jdk.internal.loader.ClassLoaders$AppClassLoader@341d43cd
    `---[1001.112942ms] RandomTest:process()
        +---[99.96% 1000.756926ms ] RandomTest:sleep() #14
        +---[0.00% 0.018639ms ] RandomTest:random() #15
        `---[0.02% 0.220952ms ] RandomTest:print() #15
2.6 watch – monitor methods in data aspect including return values, exceptions and parameters …
With the help of OGNL (Object-Graph Navigation Language), it is easy to check the details of variables when methods being invoked.
Below is an example to watch on the return values of random method of RandomTest class :
[arthas@6099]$ watch RandomTest random "{returnObj}"

Press Q or Ctrl+C to abort.
Affect(class count: 1 , method count: 1) cost in 49 ms, listenerId: 3
method=RandomTest.random location=AtExit
ts=2025-12-28 06:30:08.643; [cost=0.075991ms] result=@ArrayList[
    @Double[0.6787309192433806],
]
method=RandomTest.random location=AtExit
ts=2025-12-28 06:30:09.647; [cost=0.02542ms] result=@ArrayList[
    @Double[0.35815648410827783],
]
method=RandomTest.random location=AtExit
ts=2025-12-28 06:30:10.648; [cost=0.0272ms] result=@ArrayList[
    @Double[0.10915218803808524],
]
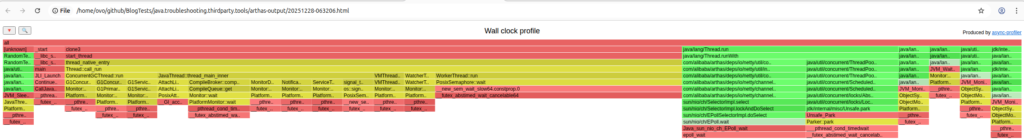
2.7 profiler – generate a flame graph using async-profiler
[arthas@6099]$ profiler start --event wall
Profiling started

[arthas@6099]$ profiler stop --format html
OK
profiler output file: /home/ovo/github/BlogTests/java.troubleshooting.thirdparty.tools/arthas-output/20251228-063206.html

[arthas@6099]$
The output of profilling is flame graph in html format :
The details about async-profiler can be found in its github repo :
https://github.com/jvm-profiling-tools/async-profiler
The exhaustive list of arthas commands can be found by below link :
https://arthas.aliyun.com/doc/en/commands.html
Conclusion
BTrace and Arthas are both very powerful open source third party tools for production java process trouble shootings.
Personally, i prefer Arthas over BTrace.
Because BTrace needs to create scripts firstly and less documented.
Especially, it has to restart the process after diagnostic done in order to get rid of its instruments.
However Arthas is much easier to use and well documented.
Its stop command allows to detach the process and erase its instruments.
No matter which one you prefer, please use it carefully and cautiously validate in the local before using it in the production environment.