

The JVM provides a rich set of configuration options that control memory management, garbage collection, monitoring, and debugging.
Understanding JVM tuning parameters is essential for diagnosing issues, improving performance, and running Java applications reliably in production.
1.Heap And Stack
The unities of memory related parameters can be K (KB), M (MB), G (GB).
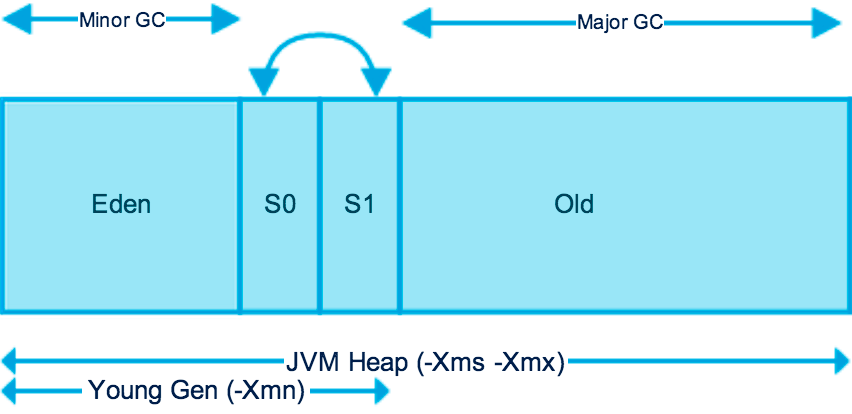
-Xms
The minimum value of the heap.
-Xmx
The maximum value of the heap. When Xms=Xmx, the heap can be made relatively stable.
-Xmn
The size of young generation.
-XX:NewRatio
Set the ratio of the new generation to the old generation.
-XX:NewRatio=2 (default value) means that the ratio of the new generation to the old generation is 1:2, and the new generation has 1/3 of the entire heap.
If -Xmn is set, this parameter does not need to be set.
-XX:MaxTenuringThreshold
The age of surviving objects in the new generation, the default value is 15.
If an object in the eden zone is alive after experiencing a MinorGC, it will be moved to the survivor zone, and its age will be incremented by 1.
For every incoming MinorGC, its age will be incremented by 1 if it is still survived.
When the threshold is reached, it will be moved to the old generation.
-XX:SurvivorRatio
The ratio of Eden zone to the Survivor zone.
If set to 8 (default value), the s0:s1:eden = 1:1:8, one survivor has 1/10 of the entire young generation.
-XX:+UseAdaptiveSizePolicy
Let JVM itself to adjust the ratio of Eden and Survivor.
By default, it is activated.
So if -XX:SurvivorRatio is used, it has to disable this by -XX:-UseAdaptiveSizePolicy.
-XX:+UseTLAB
Uses thread-local object allocation blocks.
This improves concurrency by reducing contention on the shared heap lock.
-XX:+PrintTLAB
Log the TLAB usage during each Minor GC.
-XX:TLABSize
Set size of TLAB.
-XX:MetaspaceSize
Set the initial size of the Metaspace.
Resizing Metaspace requires a full GC, which is always an expensive operation.
It can usually be observed during a startup when a lot of classes are being loaded.
Especially if the application has dependencies on many external libraries.
If there are a lot of full GCs during the startup, it’s usually because of that.
In this case, increasing the initial size can boost the startup performance.
-XX:MaxMetaspaceSize
Set the maximum size of the Metaspace.
By default, Metaspace has an unlimited maximum size.
-XX:+HeapDumpOnOutOfMemoryError -XX:HeapDumpPath=<path to dump>`date`.hprof
Instruct JVM to dump memory into file, when OOM occurred.
It can cause considerable pauses on big heaps during OOM.
However, if JVM is at OOM already, collecting as much information about the issue is more important than trying to serve traffic with completely broken application.
-XX:OnOutOfMemoryError=<command or path of command>
Specify a command or script to execute when an OutOfMemoryError exception is thrown.
-Xss
The stack size of each thread pool.
In the versions after jdk5, the stack size of each thread is 1M.
In the versions before jdk5, the size of each thread pool is 256K.
2.GC Logging
-XX:+PrintGCDateStamps -verbose:gc -XX:+PrintGCDetails -Xloggc:<path to log>
Log garbage collector activities into specified file.
All records will be prepended with human readable date and time.
-XX:+UseGCLogFileRotation -XX:NumberOfGCLogFiles=10 -XX:GCLogFileSize=100M
GC log files rotation guaranties that disk is protected from space over-consumption.
3.JMX Remote Access
-Dcom.sun.management.jmxremote.port=<port>
-Dcom.sun.management.jmxremote.authenticate=false
-Dcom.sun.management.jmxremote.ssl=false
Make JMX available for remote access on specific port which can be used to connect using any JMX tool (e.g. VisualVM or Java Mission Control).
4.Remote Debugging
-agentlib:jdwp=transport=dt_socket,server=y,suspend=n,address=<port>
-Xdebug -Xrunjdwp:transport=dt_socket,server=y,suspend=n,address=<port> (Until Java 5)
JDWP’s Options :
transport is required option.
It defines which transport mechanism to use.
dt_shmem only works on Windows and if both processes run on the same machine while dt_socket is compatible with all platforms and allows the processes to run on different machines.
server defines the way it attaches to the debugger.
It either exposes the process through the address defined in the address option.
Otherwise, JDWP exposes a default one.
suspend defines whether the JVM should suspend and wait for a debugger to attach or not.
address is generally a port, exposed by the debuggee.
5.ManagementFactory
The ManagementFactory is a factory class for getting managed beans for Java application.
This class has static methods each of which returns one or more platform MXBeans representing the management interface of a component of the Java virtual machine.
Via ManagementFactory, we can have instance of the following management interfaces:
- ClassLoadingMXBean
- MemoryMXBean
- ThreadMXBean
- RuntimeMXBean
- OperatingSystemMXBean
- PlatformLoggingMXBean
- CompilationMXBean
- GarbageCollectorMXBean
- MemoryManagerMXBean
- MemoryPoolMXBean
- BufferPoolMXBean
Below is an example of using ManagementFactory to check jvm arguments, memory usage and thread information :
import java.lang.management.ManagementFactory;
import java.lang.management.MemoryMXBean;
import java.lang.management.MemoryUsage;
import java.lang.management.RuntimeMXBean;
import java.lang.management.ThreadInfo;
import java.lang.management.ThreadMXBean;
import java.util.List;

/**
 * -Xms256m -Xmx256m
 */
public class ManagementFactoryTest {
    public static void main(String[] args) {
        // Runtime MXBean
        RuntimeMXBean rmb = ManagementFactory.getRuntimeMXBean();
        List<String> arguments = rmb.getInputArguments();
        for (int i = 0; i < arguments.size(); i++) {
            String argument = arguments.get(i);
            System.out.println("jvm argument " + (i + 1) + " = " + argument);
        }

        // Memory MXBean
        MemoryMXBean mmb = ManagementFactory.getMemoryMXBean();
        MemoryUsage hmu = mmb.getHeapMemoryUsage();
        System.out.println("used heap memory = " + hmu.getUsed());
        System.out.println("init heap memory = " + hmu.getInit());
        System.out.println("max heap memory = " + hmu.getMax());

        // Thread MXBean
        ThreadMXBean tmb = ManagementFactory.getThreadMXBean();
        long[] ids = tmb.getAllThreadIds();
        ThreadInfo[] infos = tmb.getThreadInfo(ids, 1);
        for (ThreadInfo info : infos) {
            System.out.println("thread id = " + info.getThreadId() +
                    ", thread name = " + info.getThreadName());
        }
    }
}
/*
Output:
    jvm argument 1 = --enable-preview
    jvm argument 2 = -XX:+ShowCodeDetailsInExceptionMessages
    used heap memory = 0
    init heap memory = 262144000
    max heap memory = 4171235328
    thread id = 3, thread name = main
    thread id = 13, thread name = Reference Handler
    thread id = 14, thread name = Finalizer
    thread id = 15, thread name = Signal Dispatcher
    thread id = 21, thread name = Notification Thread
    thread id = 22, thread name = Common-Cleaner
 */